


Information - Water pumps, booster sets
Pump Performance Curve
Pump Performance Curve
Author Akvedukts
A pump performance curve is a graph that shows how much fluid a pump can move in relation to the height (pressure) it needs to deliver it. The x-axis of the graph always represents the flow rate (capacity), while the y-axis represents the pump pressure (head). The pump performance curve displays the maximum pressure and maximum flow parameters, and helps identify the pump's potential operating points.
Symbols and Units of Measurement
- Flow rate or capacity (Q) is expressed as the volume of water delivered per unit of time, for example, liters per second (l/s), liters per minute (l/min), or cubic meters per hour (m³/h).
- Pressure in most cases is expressed in meters of water column (mH₂O, or simply H), and the unit of measurement is meters (m).
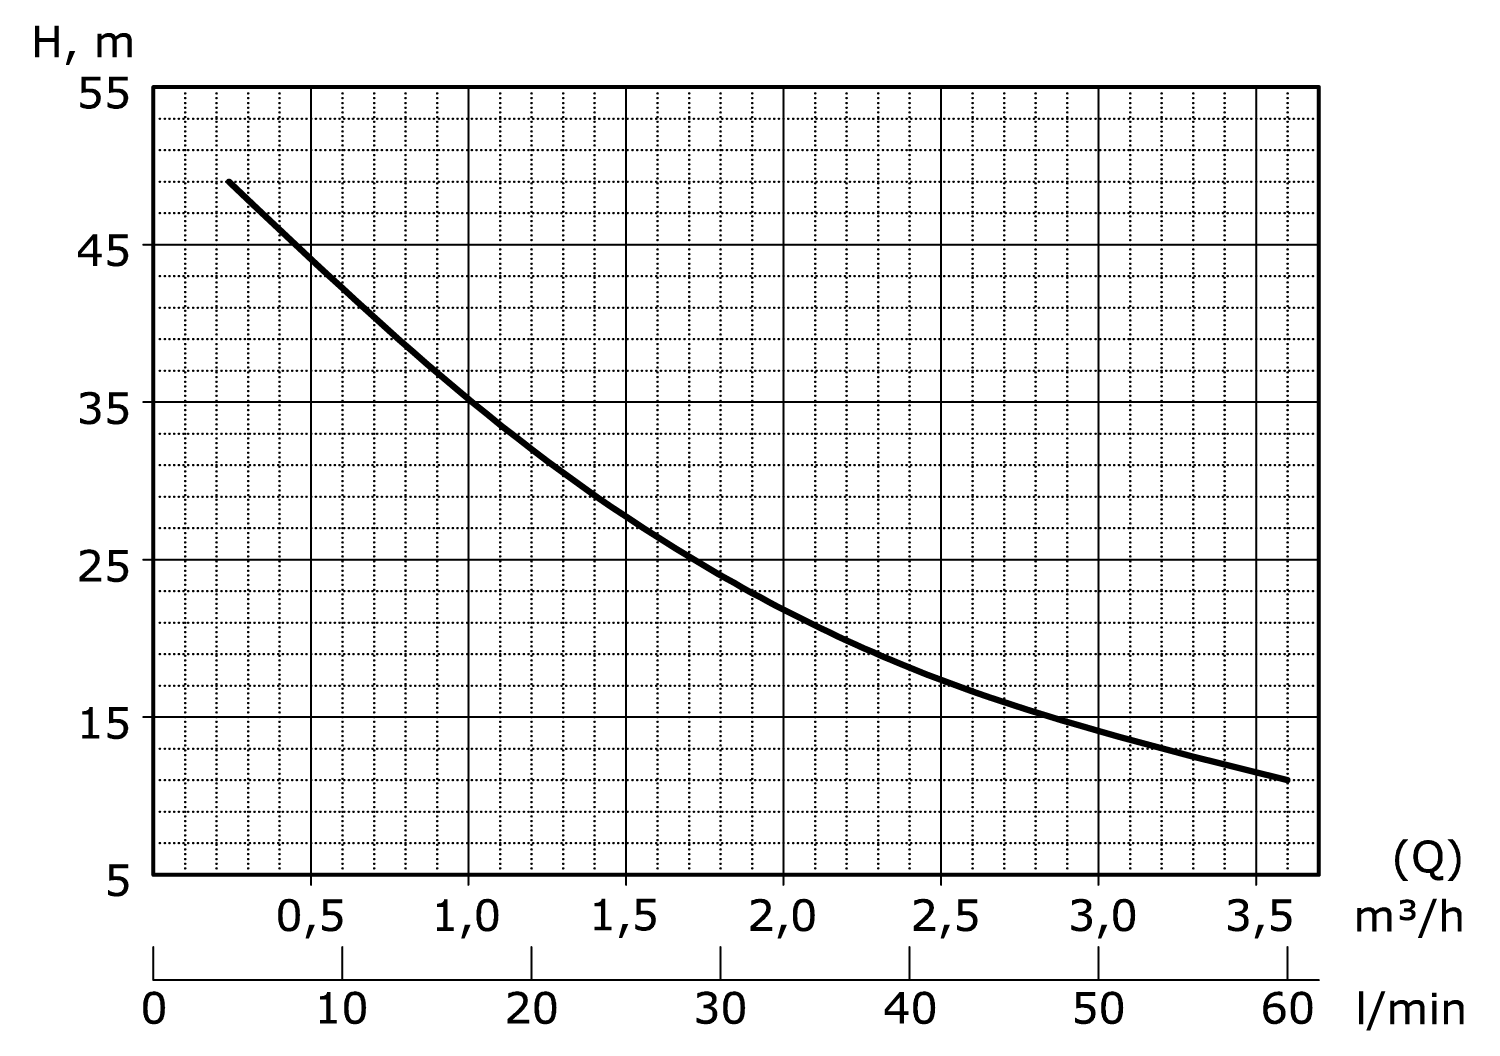
Figure 1. Pump performance curve. Performance curve for a pump with a maximum flow rate (capacity) of 60 l/min (3.6 m³/h) and a maximum head of 49 m.
Maximum Flow Rate or Capacity
The maximum flow rate of the pump (Qmax) is shown at the lowest, furthest point on the graph along the x-axis. As shown in the graph (Figure 1), the maximum flow rate of this pump is 60 l/min, or 3.6 m³/h. The maximum flow rate is achieved at the lowest pump pressure (11 m).
Maximum Pressure (Head)
The maximum pump pressure (Hmax) is shown at the highest point of the graph along the y-axis. The maximum pressure of this pump is 49 meters, which is reached at a very low flow rate (2 l/min).
Pump Duty Point (Operating Point)
The pump duty point is a specific point on the graph that corresponds to the actual operation of the pump at a given flow rate and corresponding pressure. A pump can have as many duty points as can be plotted along the performance curve. The pump operates most efficiently (highest efficiency coefficient) when the duty point falls within the middle section of the curve. Operating the pump at the extreme ends of the curve significantly increases energy consumption and shortens the pump's lifespan.
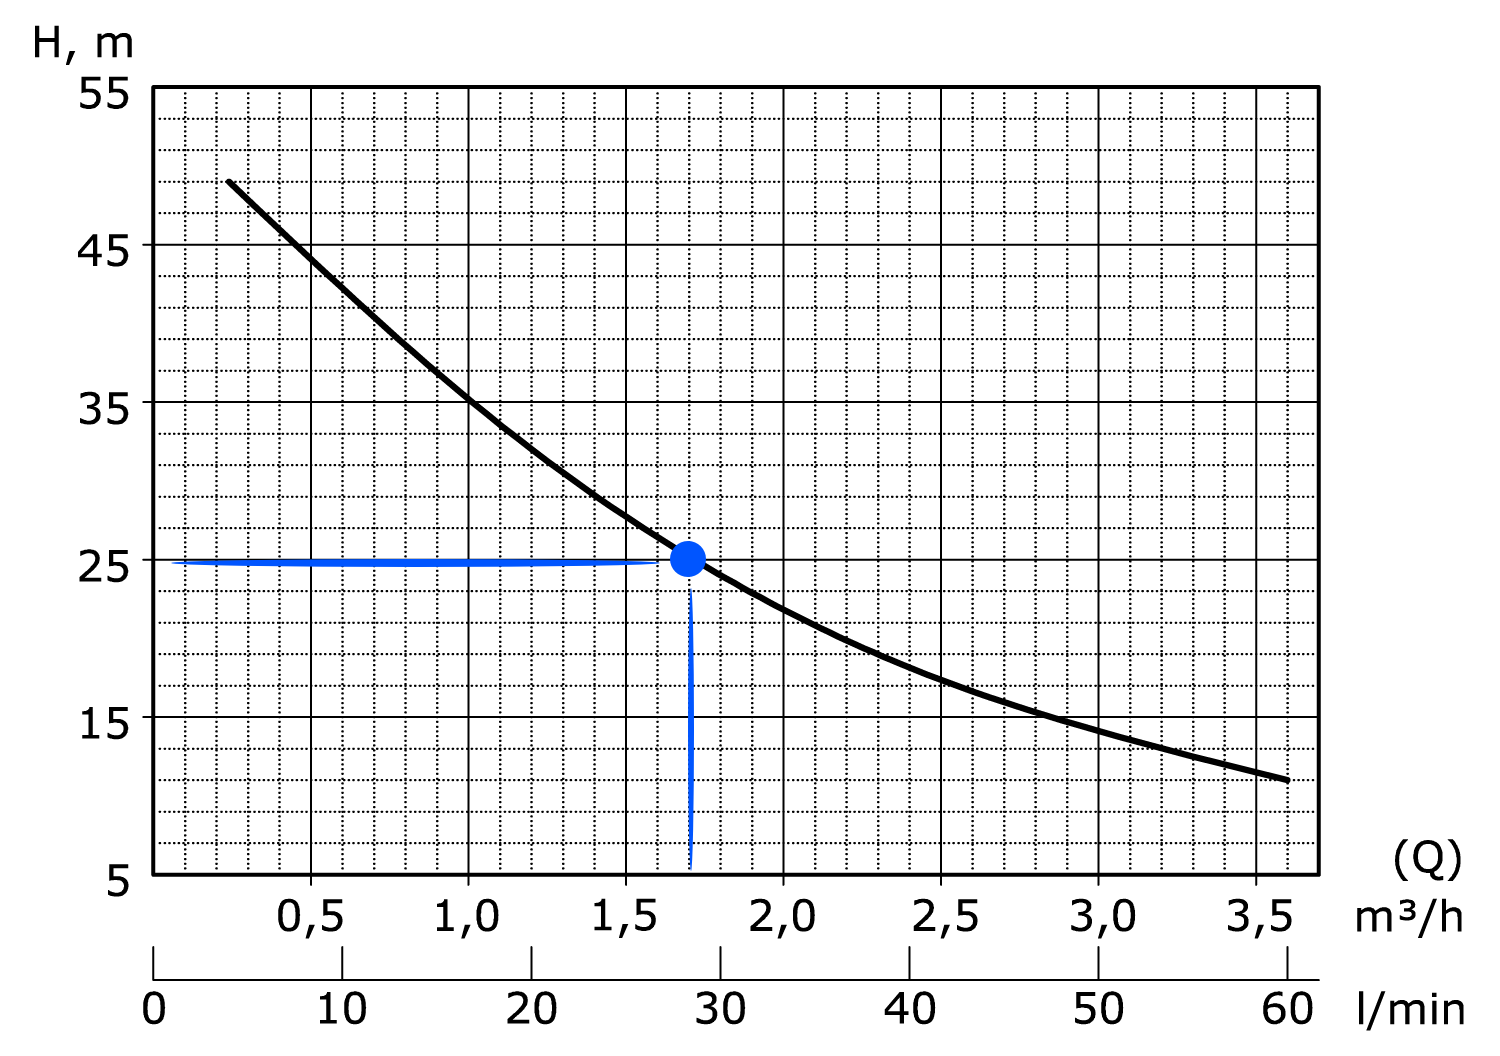
Figure 2. The pump duty point is indicated on the performance curve – 1.7 m³/h at 25 m.
The pump duty point indicated on the performance curve (Figure 2) shows that at a flow rate of 28.33 l/min (1.7 m³/h), the pump will provide a pressure of 25 meters. Depending on the water flow or pressure requirements, the duty point can be located anywhere else on the curve. For example, the duty point could be 1 m³/h at a pressure of 35 meters, or 2.3 m³/h at a pressure of 19 meters.
Pump power (P, kW), pressure (H, m), and flow rate (Q, m³/h) are interdependent variables. Maintaining constant pump power, if system pressure increases, the flow rate decreases, and vice versa – if demand for flow rate increases, pressure decreases.
Pump Selection Using the Performance Curve
To ensure that a pump is sufficient to provide both the required flow and the required pressure, these parameters must first be defined. First, the required pump capacity is determined based on the number of consumers and the simultaneity of consumption. Let's assume it is 30 l/min. Next, all aspects relating to pressure must be clarified: how high the pump needs to lift the water on the suction side (Hsuction), how high the water needs to be lifted after the pump (Hgeom) to reach the consumption device, what the pressure losses due to friction and other resistance in the pipeline will be (Hloss), and what pressure must be ensured at the appliances (Hcons).
Let's assume the pump needs to lift water from a depth of 3m (Hsuction = 3.0m), lift the water 5 meters higher after the pump (Hgeom = 5m), energy loss due to friction in a 30-meter-long discharge line is 0.0175m per meter (Hloss = 30 x 0.0175 = 0.525m), and a minimum pressure of 1 bar (10m) must be ensured at the appliances. Thus, the total pressure to be generated by the pump is Hsuction + Hgeom + Hloss + Hcons = 3m + 5m + 0.525m + 10m = 18.525m. To be safe, an extra 10% is added to this calculation (for local pressure losses, measurement inaccuracies, long-term pipe clogging) – 18.525 + 10% = 20.4 m.
Based on this calculation, we have determined that we need a pump capable of delivering 30 l/min at a pressure of at least 20.4 meters.
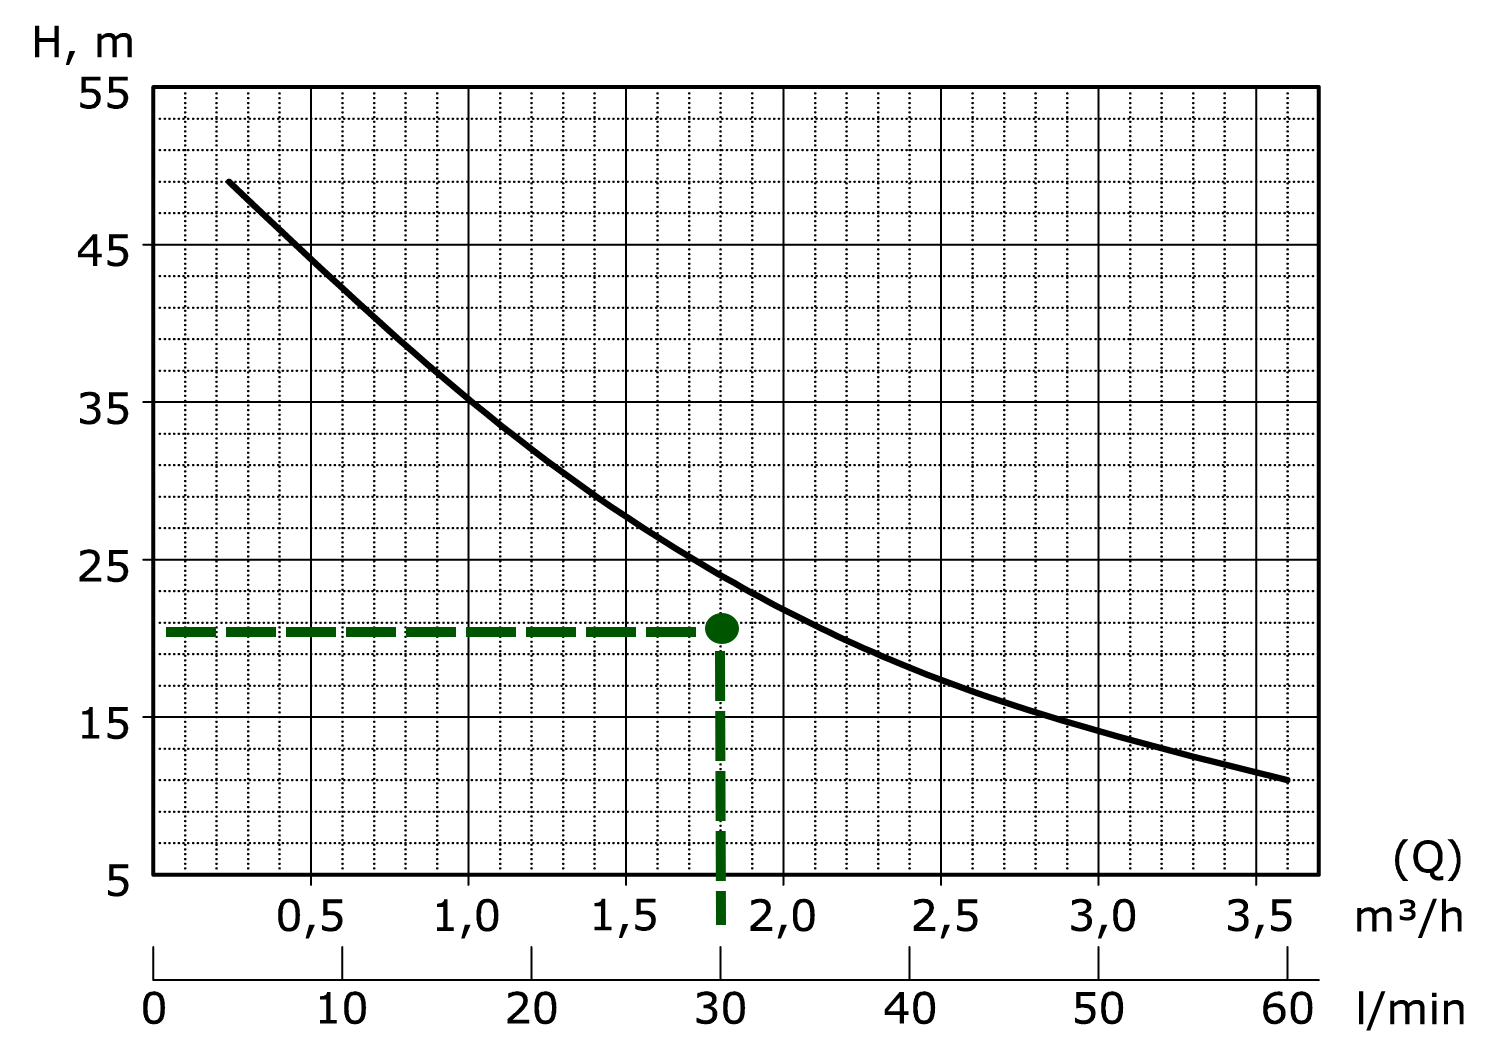
Figure 3. Pump duty point of 30 l/min at a pressure of 20.4 meters.
As seen in the graph, the calculated point lies below the pump performance curve, close to the middle section of the curve; therefore, it can be stated that this pump will fully meet the consumption and pressure requirements. It should be noted that in real life, the pump will operate at the nearest point on the pump performance curve, meaning the pressure will be approximately 2 meters higher.
If the calculated duty point were above the pump performance curve, a more powerful pump would have to be selected.
If you need assistance in selecting the right pump for your specific system, please feel free to contact the Akvedukts specialists.